BP – Charting tool
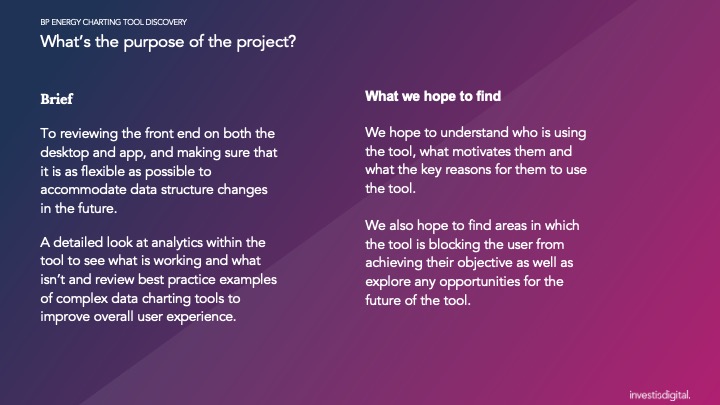
BP has found a drop in page views and usage in the desktop application compared to their mobile app offering of their energy charting tool. They wish to find out what is causing the drop and determine if there is a way to improve the current tool. There has also been external feedback from external senior members of the Financial Times that have openly said the tool is fiddly and tough to do a single pointed task.
Task
Objectives: 1) find user pain points and ways to improve the current tool on the desktop so that it's an easier and intuitive experience. 2) The tool should be an easy experience even for someone without domain knowledge. 3) The hope is to improve the page ranking on desktop
Cover
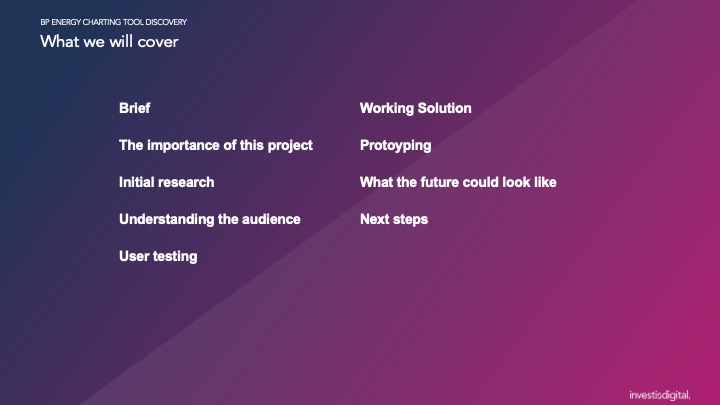
What we will cover
Summary
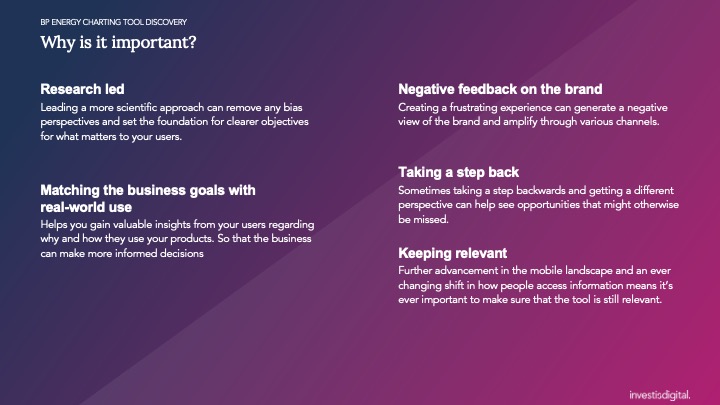
Why its important?